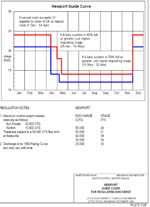
The water from the bottom of the lake to 628.5 feet (above sea level) makes up the Conservation Pool. If the lake fell below this level, we would really be hurting for water! In this condition, water would not be released except under the direst of circumstances.
So, what ARE the levels on the White River going to do? Sometimes Im sure it seems like water generation patterns from our dams are completely random…
But you will be able to make some reasonable generalizations after you read this section… its really not black magic or voodoo! It will be sort of like making generalizations that its more likely to be hot in July than in December. Here, well talk about the primary decision-making element that affects water releases — the 1998 Water Control Plan the US ACE uses as a general guideline.
With that said, Ive created the quick links above for you to view the same data we look at, and Ill do my best to explain the significance of each.
DID YOU SEE THE MONSTER BROWN TROUT CAUGHT BY OUR GUEST? 28.7 LB OF FEMALE BROWN TROUT LOVELINESS! WATCH THE VIDEOhere.
Now, theres a few things you should know about the forecasts. The two most frequently asked questions are answered by the SWPA website, which I am quoting below:
From 654 feet to 695 feet, the US ACE (Army Corps of Engineers) is in control of the flood pool. They will hold back and / or release water, primarily focusing on flood control needs. For example, if we have heavy spring rains, and the Buffalo River is running high, the Corps will hold back the water as much as possible to prevent flooding in this area.
And, since you see the waters generally shutting off around midnight, youll know that by 7:30 the next morning, the water will be fairly wade-able in our spot.
up to 1 generator – approx speed = 1.75 – 2.0 miles per hour
Dissolved Oxygen & Temperature Reports – Bull Shoals, Norfork, Calico Rock, June 1-Dec 1
I call the Newport Gauge the trump card, because if it wasnt for the considerations based on the current levels of this gauge, the flows of the White River would be much more predictable. Managing river levels to the Newport gauge is done to protect farming interests down river.
So what does this mean for generation when SWPA has their finger on the button? It means that they will abide by the same guidelines when they do release water, but they dont have to release water. When theyre in control, theres often less generation on weekends than during the week, for example.
Dec 1 – April 14 — the Newport gauge is regulated to 21 ft., except if a natural rise exceeding that occurs, then they can regulate to 24 ft.
Special circumstances and requests for variance are also defined.
Keeping this math in mind, you can relate the information in the tabular graph to the number of generators running. For example, look at the last line of complete information. You have 19130 CFS running, generating 285 MWH of electricity. Since we know that 3300 CFS is max for one generator, 19130 / 3300 = 5.8, or obviously youd round up to 6 generators. You can also take 285 / 48.88 = 5.83 – once again, 6 generators. And, no, it never comes out exactly even. As mentioned earlier, generators are usually running at less than maximum capacity.

Waders who look at this graph would also take note that the water has been rising very quickly, so you would be SURE to get out immediately when you see the slightest change, wouldnt you? 🙂 (Of course, you ALWAYS do this anyway…)
The Newport gauge is currently below 14.
7 to 8 generators – approx speed = 3.5 – 5.0+ miles per hour
Therefore: CFS / 3300 = number of generators & MWH / 48.88 = number of generators.
So, our guests want to know, Whats the river going to do? Its never an easy question to answer. We have certain online data that we use to try and answer that question, but at the end of the day, you might liken it to a weather forecast; it depends where youre at and what time it is, its subject to change, and at best you never know much outside of a few days. However, knowing as much as possible about the water conditions will make your experience on the White River a safer and more enjoyable one!
US ACE LAKE LEVEL AND POOL FORECAST LINKS
You may also keep in mind that the further you get down the river, the more subtle the rises and falls of the tail water levels are. Basically, the further down the river you are, the less surge you get.
Now control is in the hands of SWPA (Southwest Power Administration, a quasi-governmental agency which is part of the Department of Energy). Unlike the Corps, whose job it was to get rid of that extra water, the job of SWPA is to make money with the water. So, they wont run it just for the sake of running it. Theyll run water to generate power at peak demand times, when they can make the most profit.
5 to 6 generators – approx speed = 3.25 – 3.5 miles per hour
Here we have the tabular output of the same information. The difference is that this information is presented hour by hour in a numerical format for a 36 hour period. The elevation column is the same as the information youd see in the HW (headwater) graph, the TW (tail water) graph, and the flow and power graphs. As you may have noticed, the Turbine Release and Generation always lags a bit behind the tail water and elevation information.

US ACE Water Management Home for the White River Basin
Gauges of interest are the Buffalo River Gauge at St. Joe, the Crooked Creek gauge at Yellville, the White River at Newport gauge, the White River at Calico Rock gauge, and the White River at Highway 341 gauge. If you see any or all of these gauges spike from rain (all are between 11 and 40 miles down river from our resort, and will include waters from un-dammed tributaries) then you can probably bet they will throttle back or shut off the water at Bull Shoals Dam. (Just a note on the m site: You must select Little Rock District from the drop down menu, and then select White River Basin to see the relevant info.)
OK, How about a practical example to make this more meaningful to you?
![]()
Q: Why was generation at a particular project different from the schedule?
Q: When are the generation schedules updated?
These links will take you to the US ACE water management website, where you can view the lake level and pool forecasts, and another linked sister site to give you information on various stream gauges. (This is important because certain stream levels rising will make the Corps shut the water off for a time to avoid flooding downstream.)
(Side note: In the past, their operational mandate has created situations of extended periods of dead-low water that have caused fish kills and has damaged the river, and why the Minimum Flow Initiative is so important. Soon, these extended periods of dead-low water will be a thing of the past.)
While the Corps primary concern, of course, is flood control, they will work with SWPA to release flood pool water so it is most advantageous to them. Likewise, if the water level was somewhere in the Power Pool, SWPA would not run water that would promote flooding. The Corps and SWPA also work together on smaller water releases in order to keep temperatures and dissolved oxygen to at least minimum acceptable levels.
The rest of this page is somewhat technical, and honestly will bore a lot of readers! If you would rather we tell you what we think is going to happen, give us a call or send an email and well be happy to fill you in! But, so many of you have expressed a genuine interest in this topic, we felt a page on our website should be dedicated to it.
Bull Shoals Tail water GRAPH and TABULAR – (real time from USACE)
There are 3 major factors involved — the season, the current level of the Newport water gauge, and the combined 4-lake capacity of the flood-control pool, as measured above their target levels.
The Corps operates on a 50 year old mandate to keep the lake at a target level of approximately 654. It was believed that this target level allows enough margin for flood control above this mark, and adequate power generation potential below it.

US ACE – Lake Levels & Pool Forecast
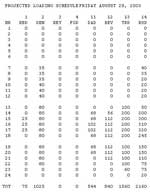
Now for the projections. I just picked a section of this report. Column 14 BSD (Bull Shoals Dam) is the only one were interested in anyway. Hour 1 starts at midnight, of course. The numbers are represented in MWH. So, for Bull Shoals, it looks like theyre going to turn on one generator at about 7:00 AM and throttle it up and down till around 2:00 PM. At this time, they are going to run on 200 / 48.88 = 4.09, which really means 5 gens operating below capacity. At 3:00, 300 / 48.88 = 6.14, or 7 generators, etc.
WHITE RIVER FLOW INFO, DAM GENERATION, FORECASTS, LAKE LEVELS, PREDICTIONS, LINKS
May 8 – November 30 — the Newport gauge is regulated to 12 ft., with the exception of regulating to 14 ft. from May 15 through November 30 if the 4-lake system flood storage exceeds 70% full.
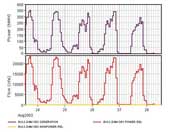
The flow section, as you might imagine, mimics the power generation section. The red line represents a power release, and the yellow line a non-power release. What is a non-power release? When water is run for any other number of reasons, such as a Corps request for example. The generators are not on-line during these releases, as water can be released via the flood gates or slouse pipes instead. Since water is money, this kind of release is not a frequent occurrence.
This next section of the graph is the most useful, in my opinion. Power generation for Bull Shoals Dam is shown in Megawatt Hours. Maximum Power output from the dam is 391 Megawatt Hours. With 8 generators, this averages out to 48.9 MWH max per generator. (The generators are not truly equal. The first 4 are slightly smaller than newer 4, but since you never know which theyre running, it makes the most sense to average them.)
1 to 2 generators – approx speed = 2.25 – 2.5 miles per hour
The most helpful use of these tools is to spot trends, which can last anywhere from a few days to several weeks, if were lucky. When daily fluctuations begin to more or less repeat themselves, you have fairly good short term predictability. Thats why I recommend that you start watching these patterns a week or so before you visit. If a fairly consistent pattern is present, odds are good thats what it will be doing while youre here. To give you a better feel for how these numbers relate to reality, you can compare the images from our Live River Cam to the amount of water thats currently running. In other words, you can literally see what 10,000 CFS looks like.
(Dont forget if Bull Shoals is above pool, Norfork probably is, too. Water will have to be dropped in that lake as well, and theyll bounce back and forth with generation between the two lakes to do it.)
The 4-lake system is below 50% for this example.
Even though a tailwater system like the White River does not experience the massive fluctuations of an un-dammed river, the levels here still change significantly, often on a daily basis. This is pretty important for wade fishermen, who need to be particularly aware when the water is about to come up. At one extreme, dead-low conditions with minimum flow give us around 850 CFS (cubic feet/second), as opposed to all 8 generators at Bull Shoals Dam running at capacity, which is approximately 26,400 CFS.
A: Schedule information is generally based on Southwesterns best estimate of customers power needs for the next day, on anticipated Corps release requirements at each project, and on the availability of other resources. Actual generation is subject to change based on power demand and changes in release requirements. Assuming non-changing weather conditions, another way to estimate project generation would be to look at the previous few days generation.
You should also note that the generators are seldom run at 100% max output, but nearly always run in excess of 50% capacity, due to efficiency factors.
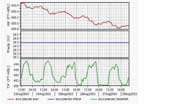
This next section of the graph shows the headwater (lake level), precipitation, and tail water levels (measured just below the dam) for any given 5 day period. In this snapshot I captured, you can see the lake level slowly dropping, no recordable precipitation, and the swings in the tail water caused by the water releases. You can see the trend for this 5 day period has been to release water later in the afternoon. OBS = Observed
Norfork Tail water GRAPH and TABULAR (real time from USACE)
The Bull Shoals Lake level, for whatever reason, has risen to 657 in our example. Thats 3 ft. above pool.
But, theyre not. There are just a lot of factors, often in opposition to one another. Rainfall cant be predicted. Variances are applied for and granted for events on specific days. The farther into the future you try to predict any complex pattern, the more detail you lose; just like in a weather forecast, folks. Which is more accurate — the 3-day or the 10-day forecast?
Bull Shoals Dam PROJECTIONS – *see Column 14* (updated periodically by SWPA)
So far, so good. Now, lets say it starts raining. Crooked Creek & Buffalo, and all the other feeder creeks above this gauge start raising the water level. Guess what happens then? Bull Shoals shuts off, or throttles back accordingly.
First, let me give you a little explanation on the speed of the water. In a nutshell, more water moves faster. Knowing this will help you calculate fairly accurately when the water will arrive, or when it will have fallen out. These figures are based strictly on my own observations, and these numbers can and DO vary.
What if the 4 lake system is below 0%? (That means all 4 lakes are at their target level or lower — 0% is in reference to the Flood Control, not that the lakes are empty.) Well, the US ACE has then done their job, and gotten rid of the excess water.
White River at Newport (down-river management choke-point)
So, what is this plan all about? Basically, it dictates different release rules when crops are either more or less likely to be damaged. This is a summary:
If you are a frequent caller of the Dam generation number – you could be in for a surprise! This recording can tell you that there are no generators running, which may be true, but you can still get a lot of water coming down the river anyway from a non-power release!
So, remember the math I mentioned earlier? 391 MWH is the max output of the Bull Shoals Dam with all 8 generators. 26,400 CFS is the max water release. 391 / 8 ( of units) = 48.88 MWH (avg) max per generator. 26400 / 8 = 3300 CFS (avg) max per generator.
A: Generation at all projects is subject to requirements from the U.S. Army Corps of Engineers (Corps) and power demand. Tentative generation schedules are posted as follows: Monday through Thursday, the schedule for the following day will be updated at approximately 5 p.m. On Friday at approximately 5 p.m., the schedules for Saturday, Sunday, and Monday will be updated. Please be aware that schedules are subject to change to meet power demand. In addition, they only reflect releases through the hydropower facilities and do not include spillway releases ordered by the Corps.
This corresponds to about an 11 ft. change at our point in the river. Right now, you may be thinking that sounds like a pretty massive fluctuation to you… 8 full generators running at capacity is a lot of water. But, everything is relative. Consider that in 2008 alone, weve seen the Buffalo River (un-dammed) fluctuate nearly 3 times that amount on more than one occasion.
Take the distance from the dam in miles, and divide by 2 for approx 85% of the water to fall out. For example, were 15 miles down from the dam. If the dam is putting out 25,000 CFS, in 7-1/2 hours after shut-off, the level will be down to about 3750 CFS.
Norfork Dam PROJECTIONS – *see Column 15* (updated periodically by SWPA)
US ACE – 1998 Water Control Plan & Newport gauge considerations
3 to 4 generators – approx speed = 2.75 – 3.0 miles per hour
April 15 – May 7 — the Newport gauge is regulated to 14 ft., with the exception of regulating to 21 ft. from April 15 through April 30, or 18 feet from May 1 through May 14 only if the 4-lake system exceeds 50% full. (Click the Lake Forecast at the top to get the current 4-lake system %.)
Will understanding this plan enable you to know if the waters going to be at 0 generators at 5:00 AM tomorrow, and turn on to 3 generators at 10:30 AM? Sorry! It sure wont. Im talking big picture, here.
All other things being equal, Bull Shoals is going to release as much water as they can until that gauge hits 14, and they get the Bull Shoals Lake level back down to 654.
You may be thinking, OK, so I can click on these links, and see all this data… But what does it mean? Why do I need to know any of this information?
Of course, points further down the White River, especially below Crooked Creek & the Buffalo, (11 & 17 miles down river from our resort, respectively) do have more drastic changes, as they receive the cumulative waters from these tributaries, in addition to releases from Bull Shoals Dam, and other feeder creeks. (Since His Place Resort is only 15 miles below the dam, we receive a negligible amount of water from feeder creeks.) The fisherman, therefore, should always be aware of his or her location respective to these confluences, especially when wading, as our central location makes it easy for guests to fish multiple sites.
Max water release from all 8 generators is 26,400 CFS (cubic ft/second). This averages out to 3300 CFS max for each generator. Take a look at the red line between the 24th and the 25th. As you can see, they turned the water on around noon, and ramped it up to about 24,000 CFS within a couple of hours. Then by midnight they had it nearly shut down.
What if we had this exact scenario, but the 4-lake system was above 50% instead of below? Bull Shoals would run to manage to 21 instead of 14, and then throttle back accordingly to try and get the Bull Shoals Lake level down to 654.
From 628.5 to 654 feet, the water is defined as the Power Pool. Between these levels, SWPA (Southwestern Power Administration – A division of the US DOE) is in control of the water. They use this water at their discretion for power through the 8 generators at Bull Shoals Dam. Computers in Oklahoma decide when to run the water, and how much. As I understand it, their primary market for selling power is peak demand times, and the electricity can be distributed over a large portion of the US.
The lake level and pool forecasts will show you the estimated dates that the lakes will get back down to the top of the power pool if it is currently over, which is sometimes indicative of when the patterns of flow may start to change.
These figures should NOT be relied on to predict safe water conditions.
I also asked about the subtle changes, when the same number of generators is running, but the output is fluctuating. I was told while the generators are usually run at a minimum of 50% capacity for the sake of efficiency, the units at Bull Shoals are also used to regulate by allowing the output to rise and fall to balance the output with the electrical demand of the system. (What this means is that when youve called the dam all throughout the day, and heard 3 generators all day long, but you swear the water has risen or fallen substantially…. youre probably right, thats just the normal fluctuation in the process.)
Our Mission Statement is a simple one… It is our goal to treat each & every customer with the utmost respect, and provide them with the ultimate in a vacation experience, and to do so with absolute integrity. May Integrity & Uprightness Protect Me, because My Hope is in God. Ps. 25:21
On Bull Shoals, as youve already learned, the target lake level is 654 above sea level. And youve also learned that when its above that level, the US ACE is in control. Their job? Get rid of that excess water. And they use the 1998 Water Control Plan to guide them. Its not as simple as run the water until it gets down to 654.
The first thing you see at the top of the Bull Shoals Tail water Graph is this header information, pictured above. The Bull Shoals Lake, which feeds our section of the White River, is divided into sections based on depth.
This is a rather simplistic scenario, to be sure. But if you take the time to read those 7 pages, and study that chart, it will make it a little more meaningful to you!
I asked about the time lag for this data. I was told that the data at the dam is stored in a device called a data collection platform (DCP). Every so often, the data is sent via satellite to the Corps computers in Little Rock. At that time, the web site information is updated.
Its April 20th, so were trying to regulate to 14 ft. on the Newport gauge.
All these are just more pieces of a fairly complex puzzle on how the water flows on the White River…
Often times, as with the sample graphs you see above, a pattern is apparent. (OK, OK, we all know it isnt always this way!) From this particular sample, you can see that power is being generated about mid day. If youre fishing in our vicinity, about 15 miles down from the dam, you can expect the water to begin to rise a little over 4 hours later. If youre in a boat, you may want to be up at Wildcat about an hour or hour and a half earlier than that and fish the rise on down, for example.
At the end of the day, what you really want to know is not how many generators are running, but how much water is coming!Now you can understand the relationship between the three.